In-store promotions are one of the most effective ways to increase your sales, but only if you know how to determine the effects of the product promotion on your company in a promotion analysis. At the end of the day, data helps you to provide insight, as it will tell you where you’ve been, where you’re heading, and where you want to be.
Here are the main metrics you should use to analyze data on the success of your in-store promotion:

Profit
Promotions, which are nothing but investments, work by earning turnover with less investment. It is important to evaluate the impact of sales promotions on profit because it is possible for promotions to lead to higher sales but lower profits.
Sales Volume
To accurately measure the increase in sales volume, you need to know your baseline (sales without promotion) using both data you’ve already collected and data you collect throughout the duration of the promotion.
This equation can be used to find your overall increase in sales:
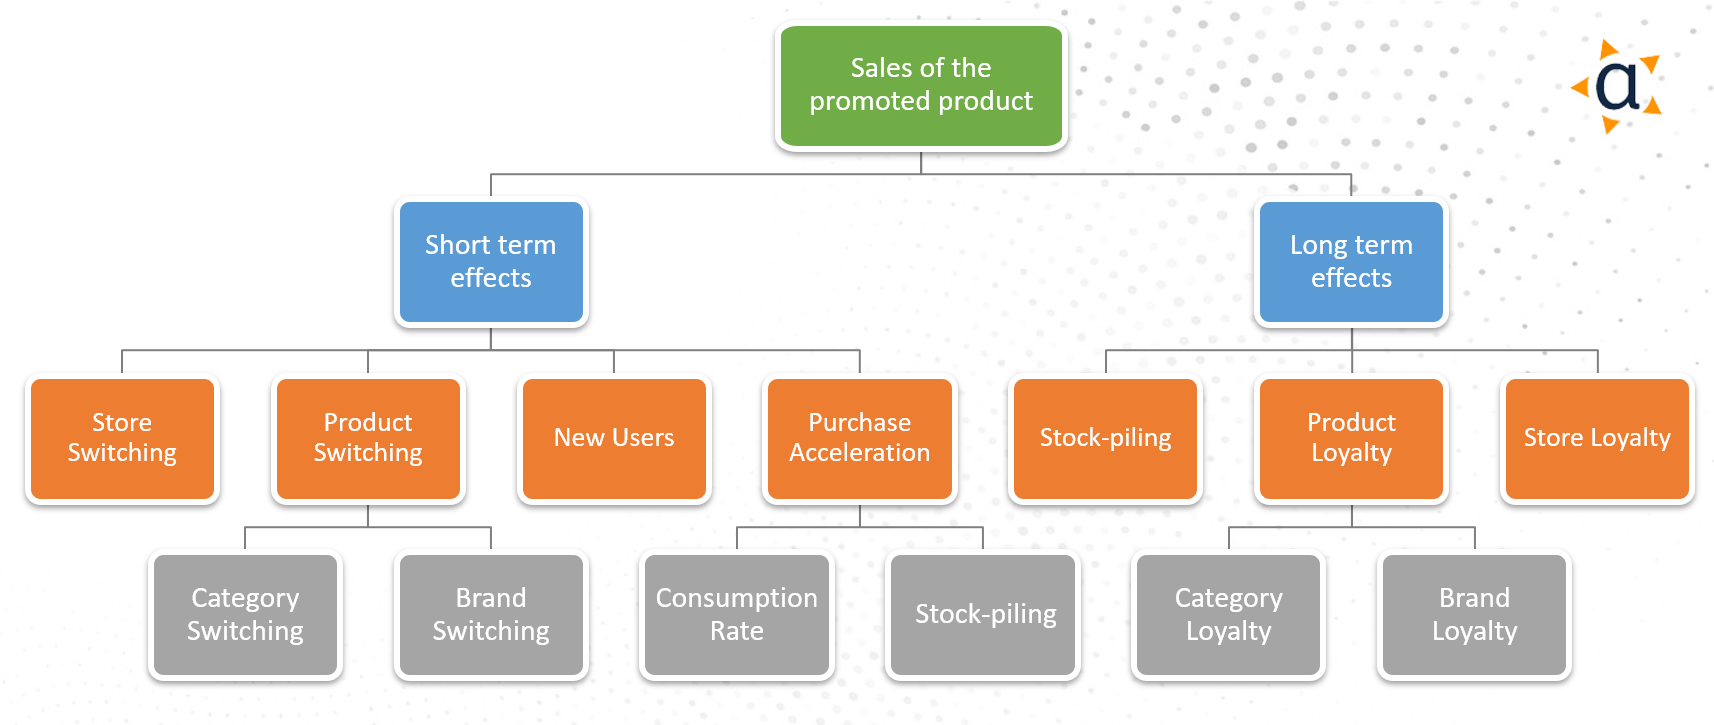
| Overall Lift = Promoted Product Sales lift + Halo – Cannibalization – Forward Buy |
- Promoted Product Sales Lift – There are multiple ways to calculate lift in Product Sales but in simple language – It is the difference between volume when Product was not Promoted and volume when Product is Promoted.
- Halo – This is nothing but encouraging to buy other products with promoted Product. So how can we get to know such Products – Simple by using basket analysis e.g. While drinking Pepsi we would love to have Snacks. Find all baskets from Historical Promoted Period data that contain Promoted Product and find such a product that has not been promoted but is present in most of the baskets.
- Cannibalization – Performance/volume of product is decreasing due to Promotion of other products of the same category (Can be found out on brand level). Find out historic Promotions of products and see their effect on Category and competing products of the same category. Promotion may lift sales but at the category level sales may drop as well due to Cannibalization. e.g If Dove Soap has 50% off why would I choose Lux Soap.
- Forward Buy – Retailer buys larger volume of Promoted Products than usual volume and would not buy in regular frequency until they are out of stock. How to find – If the retailer baseline is less than the regular baseline after the promotion period then there may be chances retailer has stocked up (Forward Buy) the product. This would not only affect Product sales but also Category sale.
Customer Satisfaction
Customer satisfaction is an important thing to customer loyalty and long-term brand switching, so you must measure customer satisfaction by collecting data to measure exactly how satisfied customers were with your discounted promotion and with your overall product quality. A few points to check customer satisfaction: Was there any out-of-stock situation? Online people comment about your brand or product. For deeper insight, try inviting your customers to fill out a quick survey or use a hashtag with the promo to tell you what they think of your brand. Using the information you gather, you’ll be able to hear the truth of what customers thought of your promotion.
Astraa’s solution to Trade Promotion
Spendo is the one-stop solution for all your “Trade Promotions” needs. Deployed in all geographies across the world with powerful features like:
- Precise evaluation of trade spending effectiveness
- Flexible views of data to support multiple business roles for any CPG Manufacturer
- Accurate harmonization of data from multiple sources is needed to fuel insights
- Effective and flexible visualization of business results through graphical and tabular dashboards
- Secure Data & Cloud Application and a Modern IT Architecture
- AI-based trade promotion optimization to spend right and get more outcomes from each Promotion
Spendo is the CPG brand of “Astraa, a Saama brand” based in Campbell, California, and has offices all around the world.

